Debugging Solidity Using Remix IDE


Learning how to code is important, but learning how to debug is even more important.
Of course, without debugging skills your codes won't run when they encounter errors. So it's very important to understand how to debug in Solidity, so as you encounter errors in your smart contracts you can be able to solve these errors.
Errors in your smart contracts can be frustrating, and what's even more frustrating is the fact that you need to solve these errors before you can be able to fully interact with your contracts. Remix IDE has made this easier for smart contract developers to debug without going through a lot of stress. In this tutorial, I'll be showing you how you can debug your smart contracts in the Remix IDE.
The remix IDE is a browser-based IDE that is used to write solidity. It is one of the most powerful tools used in debugging smart contracts. When errors are thrown in your code, and you deploy, the remix IDE gives you a link to the debugger in the IDE. The debugger gives in detail what is happening with your smart contract, showing you errors and what is happening under the hood when the smart contract is deployed. This makes it super easy to figure out what is going wrong with your smart contract and how you can be able to fix it. The debugger is not only a tool for debugging, it is also a tool for learning.
We will cover just three aspects of debugging, first debugging things in the stack, memory, and then storage.
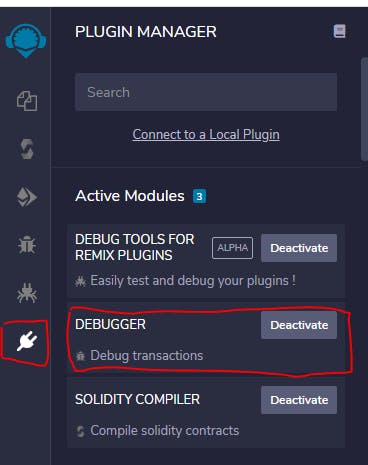
Before we cover how to use the debugging tool, there are two ways to Launch the debugger in Remix IDE.
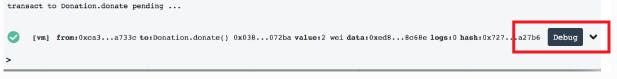
- Click on the launch debugger after deployment.
- Install the debugger Plugin in the Remix IDE, by clicking on the Plugins icon on the left sidebar of the IDE, download, and then activate.
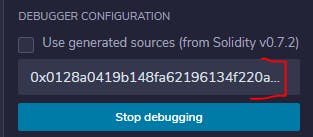
 This is where you will need to input the transaction hash to able to get the plugin to run the debugging tools for you for that particular contract.
Now let's look at an example of a smart contract that will throw an error when deployed and how we can be able to use the Remix IDE debugger tool to solve issues. In this tutorial, we will cover just debugging things in stack, memory, and in storage.
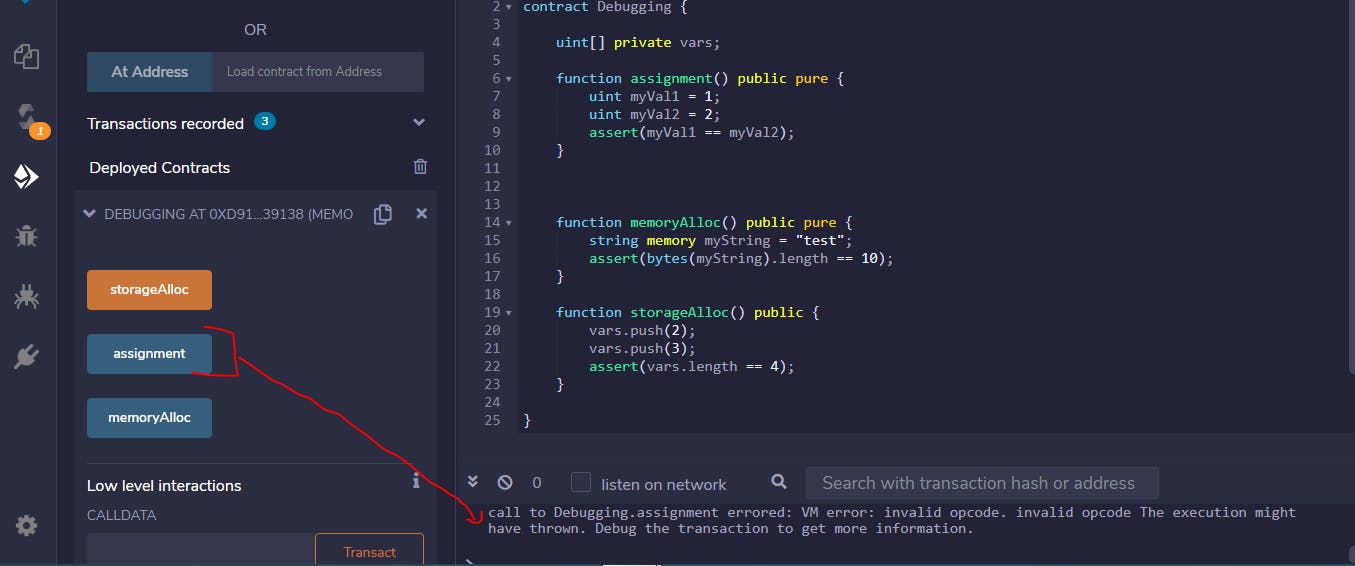
In this contract, three function has been created, "assignment", "memoryAlloc", "storageAlloc" as shown below:
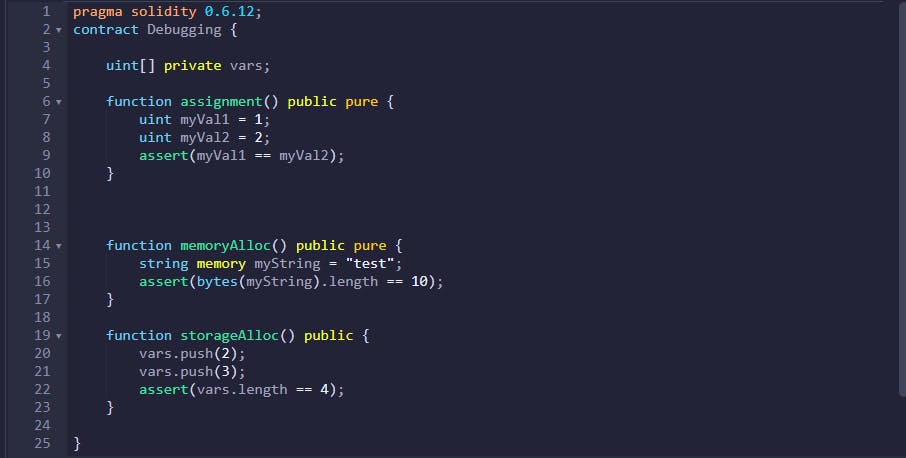
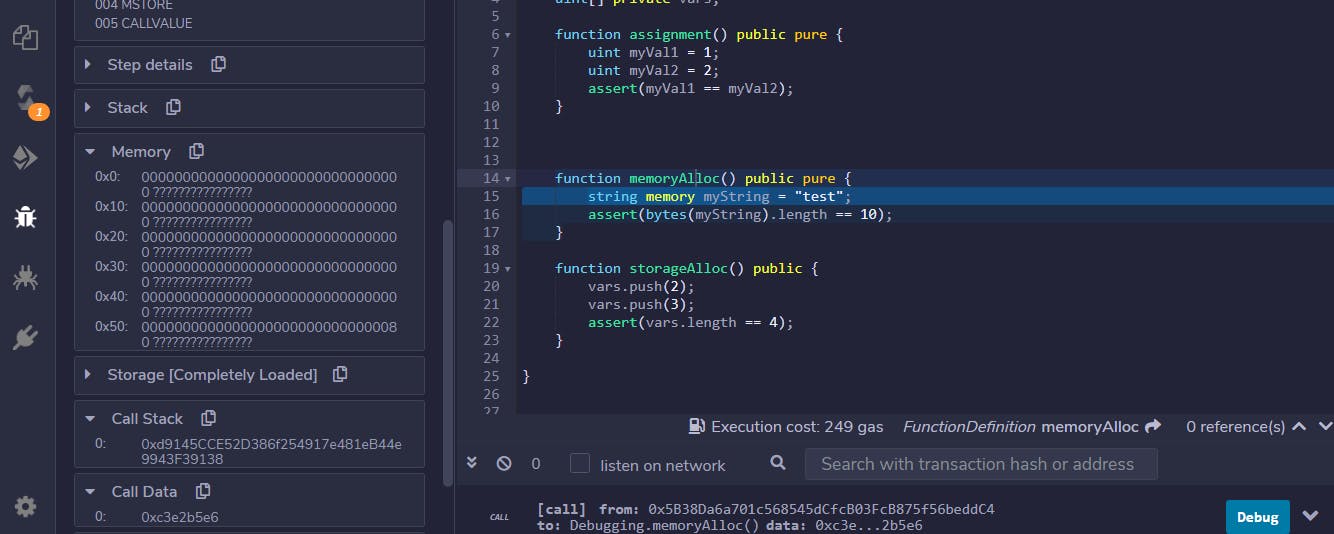
The "assignment" function has to do with looking at things in the stack, the "memoryAlloc" has to do with things located in memory. while the "storageAlloc" function has to do with storage. All of the functions have been designed to fail. We are more concerned about how to use the debugger here. When the contract is deployed and the functions are interacted with, it all throws errors. When you click on the "assignment" function, it throws an error as seen in the image below.
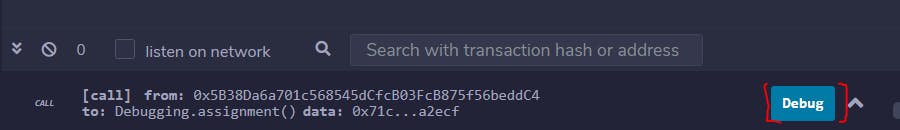
When the error is shown, in the error message box, the remix IDE shows you a button to click in order to start debugging the smart contract.
Click on the debug button and the remix IDE debugger configuration will be load.
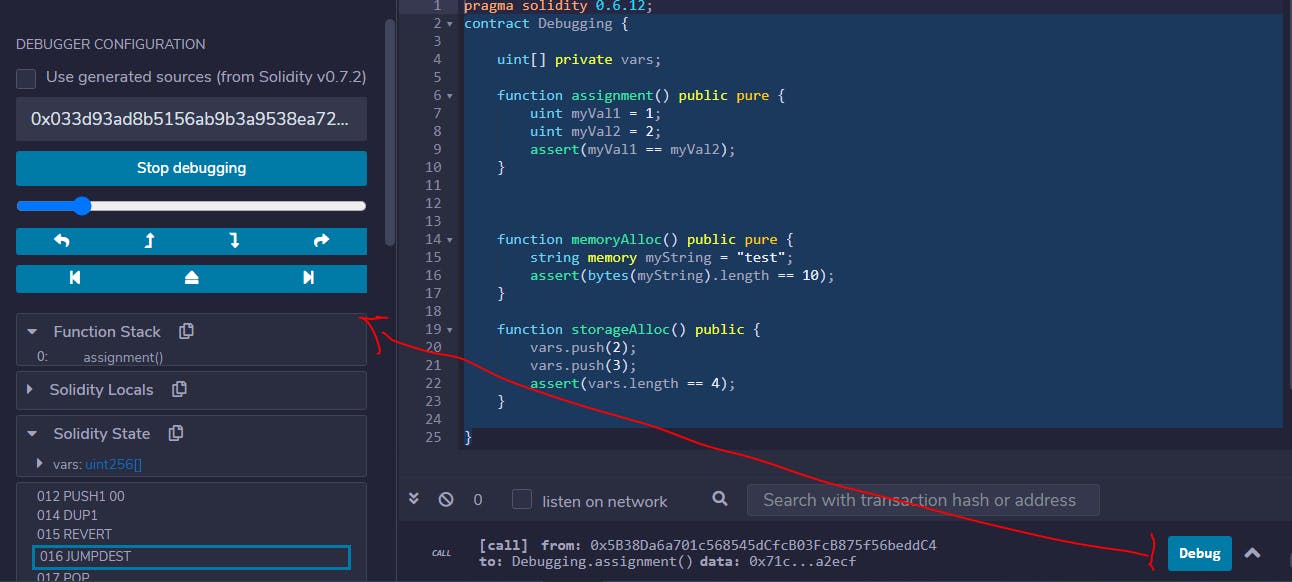
The first thing you'd notice in the debugger is that it automatically populates the transaction has, so we don't need to worry about looking for the transaction hash and inputing the into the debugger to be able to start debugging. If you are to use the debugger plugin, you must first get your transaction has and input for the debugging to start. Here we have been able to bypass this by just clicking on the debug button provided by the Remix IDE.
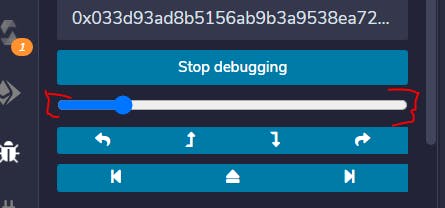
When you look at the debugger bar you will see a lot of buttons, the slider button helps us to go through our smart contracts line by line.
For the purpose of debugging the smart contract given, we would focus on debugging things in the stack, memory, and then things in the storage.
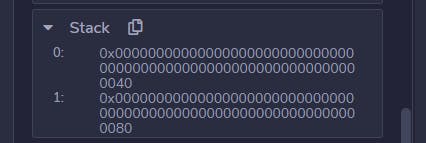
What we see first in the stack is the call to the assignment function, that is what is going to appear first in our stack.
![debuggerStack].PNG](https://cdn.hashnode.com/res/hashnode/image/upload/v1616493731614/88R9hEZzC.png?auto=compress,format&format=webp) When we step into the next line, what we are doing first is assigning the variable myVal to 1
In the stack the memory will be allocated for that variable myval 1.
When we step into the next line, what we are doing first is assigning the variable myVal to 1
In the stack the memory will be allocated for that variable myval 1.
 From the solidity locals, we see that myVal1 = 1 and myVal2 = 2, and therefore myval is not equal to myVal2, which is the error that we see from the code. That is simply why the stack allocation is failing when we deploy.
Next, we would look at is the memory allocation, when we launch that, it fails, then we launch the debugger.
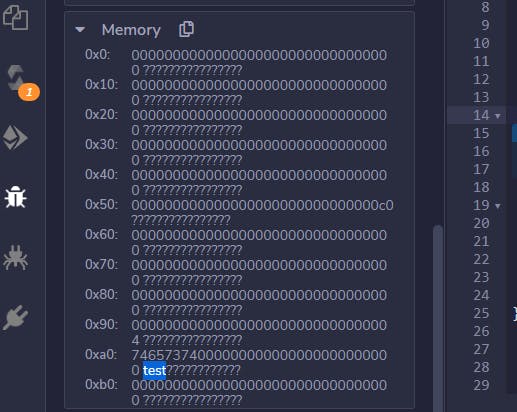
First of all, we can see the block of memory has been allocated
When we step into the memoryAlloc function we already stated that our string should be stored in memory. As at this point, we haven't actually allocated our value "test" to our memory yet. But if we step over that now, we can now see more memory has been allocated and the value of test appears in our memory.
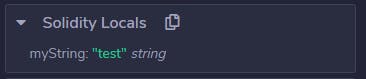
If you check the solidity locals(The Solidity Locals panel displays local variables associated with the current context.). You would find that the mystring is equal to the value test.
The extra memory comes from the last line of code written in the memoryAlloc function
assert(bytes(myString).length == 10);
which simply means convert the string to bytes and the length will be equal to 10, which is obviously not true. So we know that the length of our string is 4 and therefore the function will fail. So we have debugged that function and know and understand where the errors were coming from and now we know how we can fix it.
The final thing we would look at is the "storageAlloc" call. so we launch the function and then it throws an error, we then launch the debugger
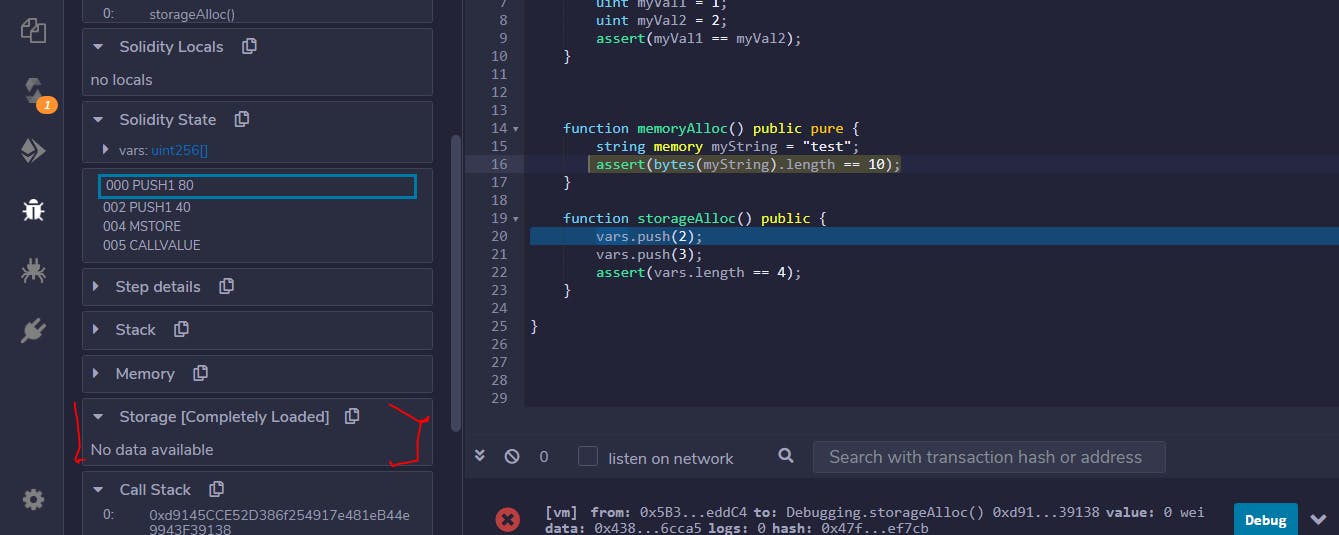 Because vars have never been interacted with before, that is why the storage is empty. we are telling it that we would like to push a value into vars array(Which is supposed to be predefined before now).
The first thing the line of code does is not actually push a value into it, it creates a space for the value in the array to be pushed into it. When we step into the function the first thing you'd see in the storage is that a value will appear in storage. This is not the actual value, if you noticed it got a value of 1, what that means is basically the size of the array.
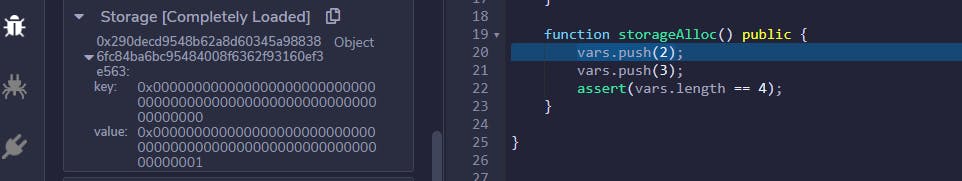
So the size of the array is only equal to 1 because we are only pushing this first value of the array in. When we step in the next line of code, the value of the storage changes to 2. This represents the value that is been pushed into the array. In this case, 2 is the number been pushed into the array. So the first value in the storage represents the size that is been pushed into the Array, while the second is the value been added to the array.
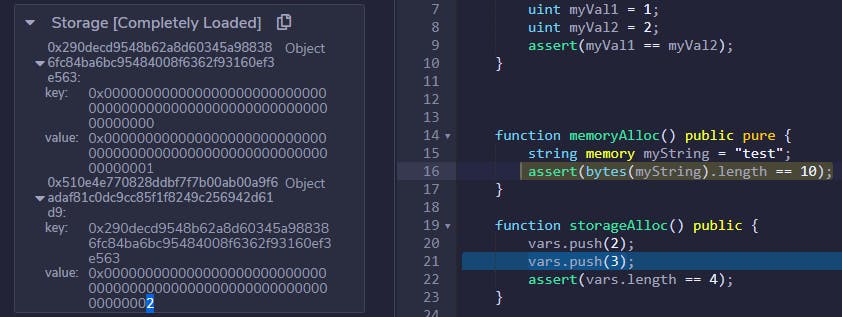
When we step in the last line we are asserting that the length of the array is equal to 4, but it is equal to 2 therefore it will throw an exception when it is launched.
This is just a basic overview of how you can simply interact with the remix IDE debugger ti be able to solve errors quickly and know what is going on behind the hood when the smart contract is deployed.
For more resources on debugging Solidity using the Remix IDE debugger; (remix-ide.readthedocs.io/en/latest/tutorial..) (remix-ide.readthedocs.io/en/latest/debugger..)
To follow me for more tutorials on solidity and on my Journey to becoming a blockchain developer, follow me on Twitter.